[AI SCHOOL 5기] 데이터 분석 실습 - 데이터 시각화
Visualization Libraries #
- Plotly
- Altair
- Bokeh (Website Graph)
- @ https://j.mp/30772sU
Data Chart Types #
- Numeric: 숫자 자체에 의미가 있음 (온도 등), 연속형
- Categoric: 숫자 너머에 의미가 있음 (성별, 강아지 품종 등), 불연속형
- @ https://goo.gl/ErLHCY
- @ http://j.mp/2JcEENe
GeoJSON Data #
python
import json

# 한국의 지도 데이터 참조
# @ https://github.com/southkorea/southkorea-maps
geo_path = 'skorea_municipalities_geo_simple.json'
geo_str = json.load(open(geo_path, encoding='utf-8'))- JSON(Javascript Object Notation): 데이터 교환을 위한 표준 포맷
- GeoJSON: 지도 데이터 포맷
json.load: JSON 파일 불러오기json.dump: JSON 파일 저장하기
PyPrnt Library #
python
from pyprnt import prnt

prnt(geo_str, truncate=True, width=80)- PyPrnt: JSON 구조 파악에 용의한 도구 @ http://j.mp/2WVZuGy

Folium Library #
python
import folium

# Folium 공식문서 @ https://goo.gl/5UgneX
seoul_map = folium.Map(location=, zoom_start=, tiles=) - Folium: 지도 데이터 시각화 라이브러리
localtion: 초기 지도 시작 위치zoom_start: 초기 지도 확대 정도tiles: 지도 타입 (default “Stamen Terrain” or “Stamen Toner”)- 초기 좌표를
[37.5502, 126.982], 확대 정도를11로 설정하면 서울을 표시
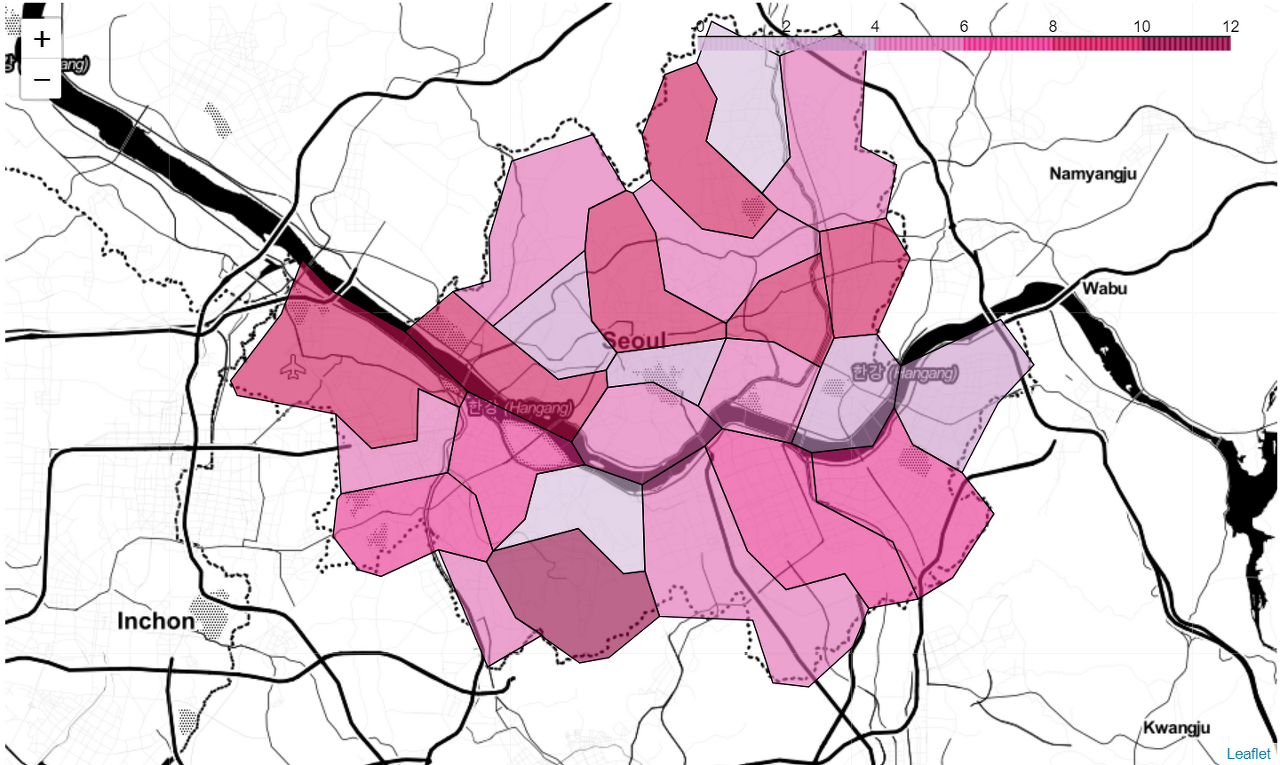
살인사건 발생건수 시각화 #
python
# Choropleth map @ https://goo.gl/yrTRHU
seoul_map.choropleth(geo_data = geo_str,
               data = gu_df['살인'],
               columns = [gu_df.index, gu_df['살인']],
               fill_color = 'PuRd',
key_on = 'feature.id')geo_data: GeoJSON 데이터data: 시각화의 대상이 될 데이터columns: DataFrame의 index column을 가져와 인식fill_color: matplolib colormap과 유사 @ http://colorbrewer2.orgkey_on: GeoJSON 규약을 따름, JSON 파일feature의id에 매칭
경찰서별 검거율 점수 계산 #
경찰서별 검거율에 대한 시각화 시 문제점
- 경찰서별 검거율의 최대-최소 차이가 17로 매우 적음
- 검거율을 원형 차트로 만들었을 때 각각의 차이가 적어서 직관적이지 못함
Min-Max Algorithm을 사용하여 검거율 점수 계산
$$z_i=\frac{x_i-\text{min}(x)}{\text{max}(x)-\text{min}(x)}$$
python
def re_range(x, oldMin, old_max, new_min, new_max):
    return (x - old_min)*(new_max - new_min) /
           (old_max - old_min) + new_min

df['점수'] = re_range(df['검거율'], min(df['검거율']),
                     max(df['검거율']), 1, 100)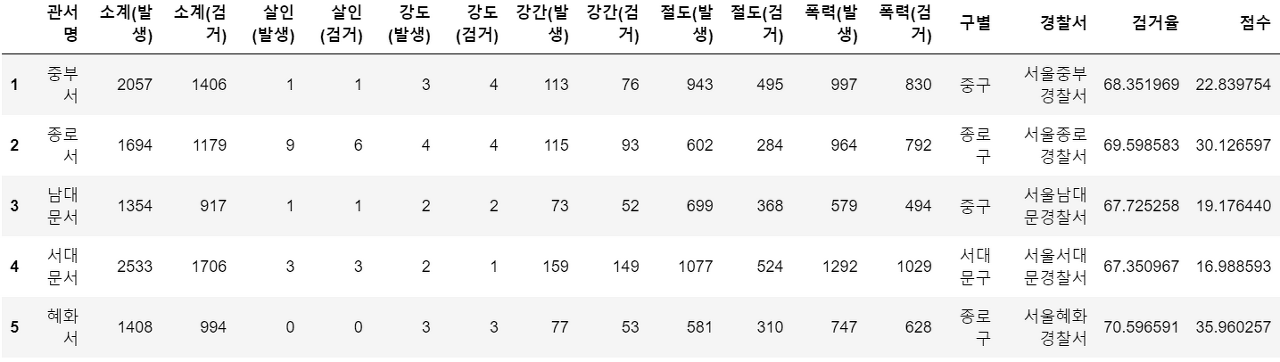
경찰서별 좌표 데이터 수집 #
강남경찰서 좌표 데이터 내용 확인
python
import googlemaps

gmaps = googlemaps.Client(key='your-api-key')
gangnam_police_map = gmaps.geocode('서울강남경찰서', language="ko")
json
[{'address_components': [{'long_name': '11',
    'short_name': '11',
    'types': ['premise']},
   {'long_name': '테헤란로114길',
    'short_name': '테헤란로114길',
    'types': ['political', 'sublocality', 'sublocality_level_4']},
   {'long_name': '강남구',
    'short_name': '강남구',
    'types': ['political', 'sublocality', 'sublocality_level_1']},
   {'long_name': '서울특별시',
    'short_name': '서울특별시',
    'types': ['administrative_area_level_1', 'political']},
   {'long_name': '대한민국',
    'short_name': 'KR',
    'types': ['country', 'political']},
   {'long_name': '06175', 'short_name': '06175', 'types': ['postal_code']}],
  'formatted_address': '대한민국 서울특별시 강남구 테헤란로114길 11',
  'geometry': {'location': {'lat': 37.5094352, 'lng': 127.0669578},
   'location_type': 'ROOFTOP',
   'viewport': {'northeast': {'lat': 37.5107841802915,
     'lng': 127.0683067802915},
    'southwest': {'lat': 37.5080862197085, 'lng': 127.0656088197085}}},
  'partial_match': True,
  'place_id': 'ChIJcbaB0UakfDURoyy8orQOWFg',
  'plus_code': {'compound_code': 'G358+QQ 대한민국 서울특별시',
   'global_code': '8Q99G358+QQ'},
'types': ['establishment', 'point_of_interest', 'police']}]gmaps.geocode: Google Maps의 Geocoding에 대한 함수, 위도/경도 및 우편번호 등 반환gmaps.reverse_geocode((lng, lat), lang=): 위도/경도 값으로 주소값 반환formatted_address: 도로명 주소 반환값geometry.location: 위도/경도 반환값 (lat/lng)
경찰서별 좌표 데이터 수집
python
lat = []
lng = []

for name in df['경찰서']:
    police_map = gmaps.geocode(name, language='ko')
    police_loc = seoul_police_map[0].get('geometry')
    lat.append(police_loc['location']['lat'])
    lng.append(police_loc['location']['lng'])

df['lat'] = lat
df['lng'] = lng
경찰서별 검거율 데이터 시각화 #
python
police_map = folium.Map(location=, zoom_start=)

for n in df.index:
    folium.CircleMarker([df.at[n, 'lat'], df.at[n, 'lng']],
                        radius=df.at[n, '점수']*0.5, # meter 단위
                        color='#3186cc', fill=True,
                        fill_color='#3186cc').add_to(map)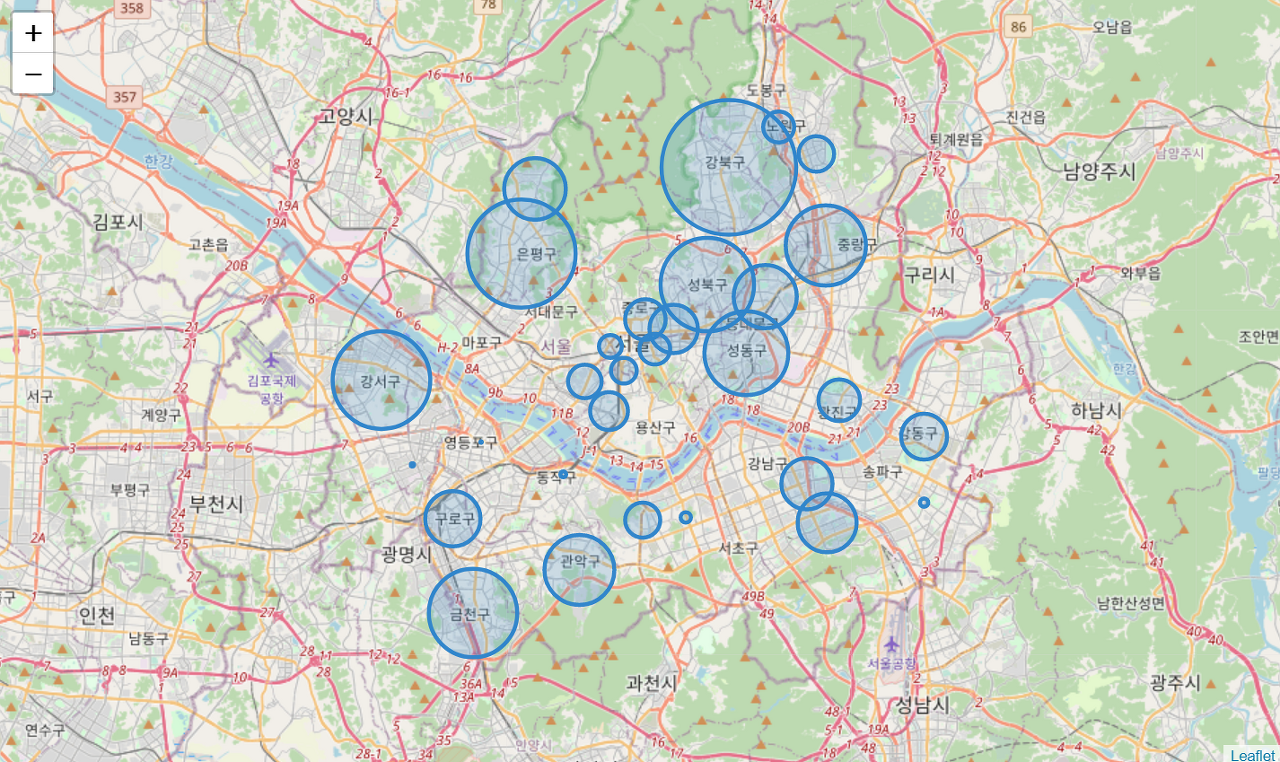
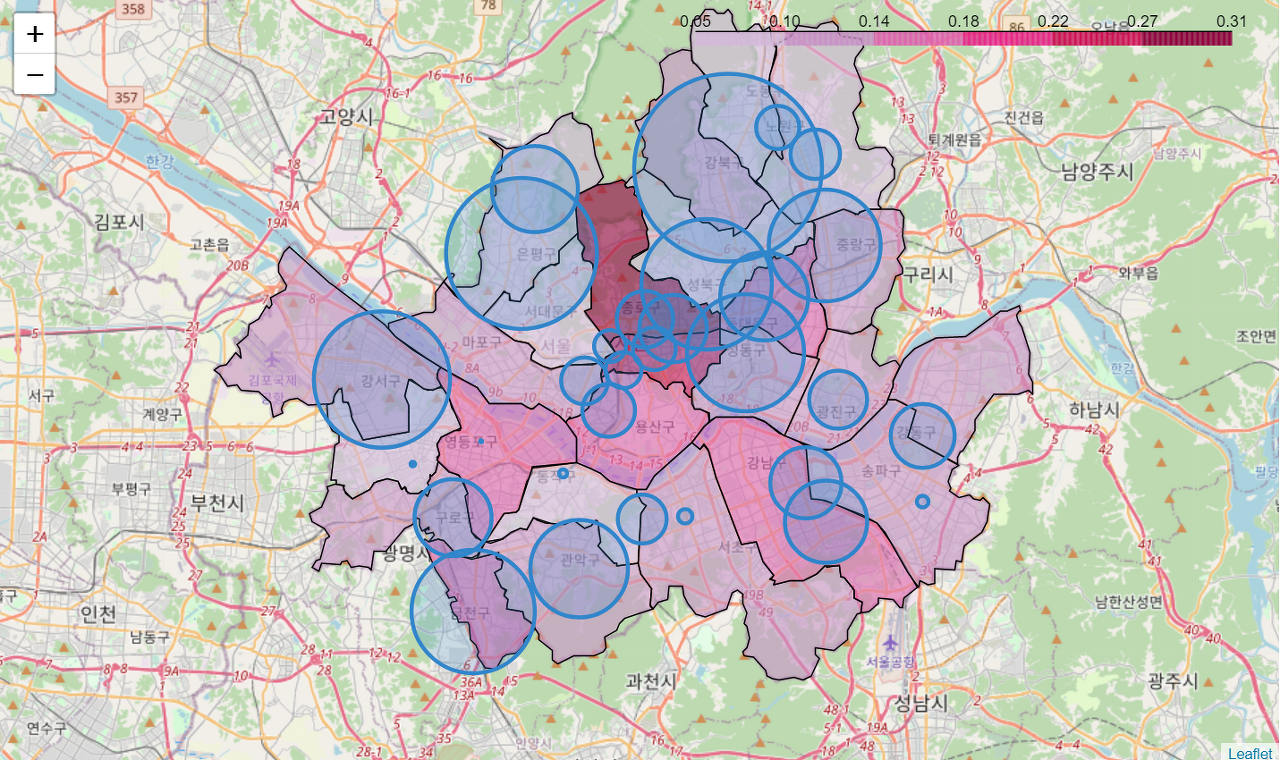
시각화된 데이터 종합 #
python
police_map = folium.Map(location=, zoom_start=)

police_map.choropleth(geo_data = geo_str,
                      data = crime_ratio['전체발생비율'],
                      columns = [crime_ratio.index,
                                 crime_ratio['전체발생비율']],
                      fill_color = 'PuRd',
                      key_on = 'feature.id')

for n in df.index:
    folium.CircleMarker([df.at[n, 'lat'], df.at[n, 'lng']],
                        radius=df.at[n, '점수']*0.7,
                        color='#3186cc', fill=True, fill_color='#3186cc').add_to(police_map)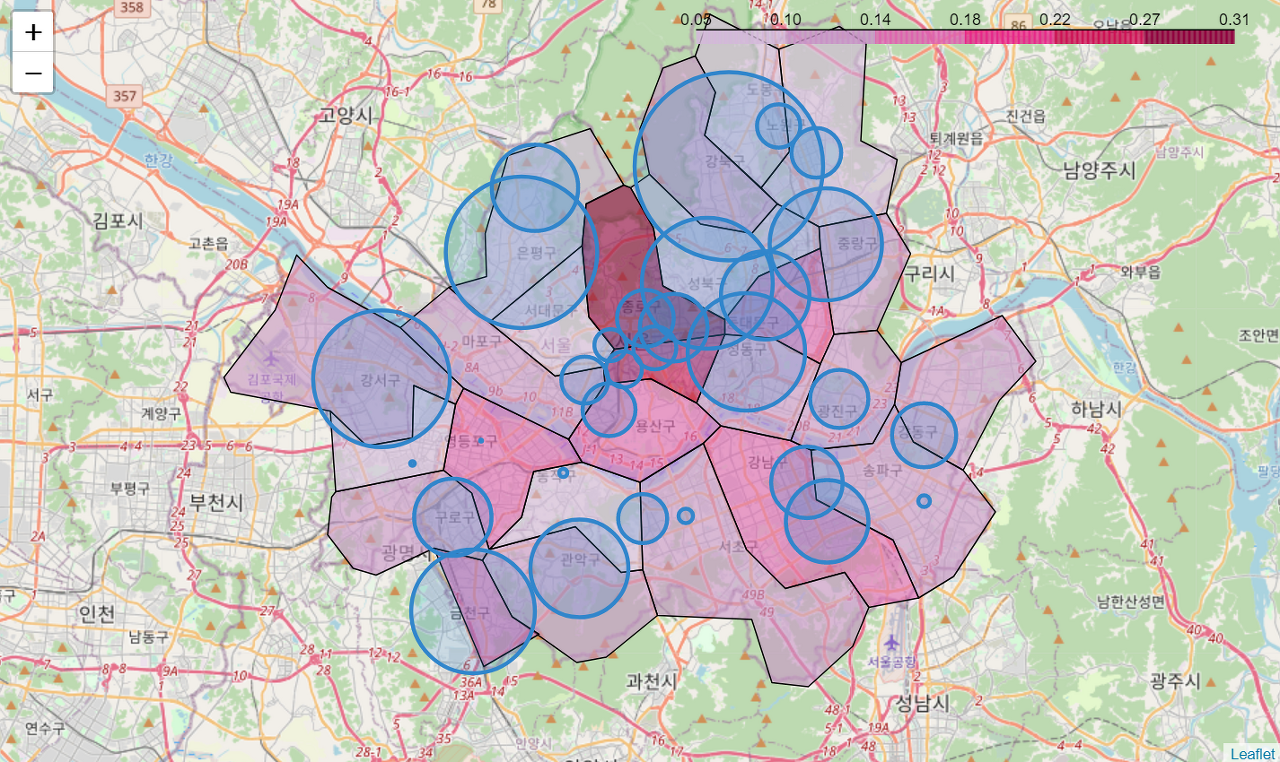
Export DataFrame #
- DataFrame to csv file
python
df.to_csv('processed_data.csv', encoding='utf-8')- DataFrame to Excel file
python
from pandas import ExcelWriter

writer = ExcelWriter('file_name.xlsx')
df.to_excel(writer)
writer.save()- Saving a folium map as an HTML file
python
folium_map.save('folium_map.html')HTML 파일로 시각화된 지도 데이터 추출
GeoJSON Data (Not Simplified) #
python
geo_path = 'skorea-2018-municipalities-geo.json'
geo_str = json.load(open(geo_path, encoding='utf-8'))features.properties.code에서 서울 내 지역코드는 11로 시작- 기존
features.id는feature.properties.name과 매칭 choropleth실행 시key_on에feature.properties.name입력
서울 내 지역만 수집 #
python
in_seoul = []

for feature in geo_str['features']:
    if feature['properties']['code'].startswith('11'):
        in_seoul.append(feature)
구체적인 데이터로 구현한 지도 #