[AI SCHOOL 5기] 머신 러닝 실습 - KNN
K-Nearest Neightbor Algorithm #
- 기존의 가까운 이웃 데이터를 살펴 새로운 데이터를 분류하는 알고리즘
- K=3일 경우, 가장 가까운 나머지 3개 중 2개가 Red면 Red로 판단
- K 값이 작아질수록 아주 작은 영향에로 판단이 바뀌는 Overfitting 발생
- K 값이 커질수록 멀리보고 결정이 느려져 Overfitting 감소
Learning Process #
Load Data #
python
iris = datasets.load_iris() # 붓꽃 데이터 (150행, 4열)Select Feature #
python
x = iris.data[:, :2] # [꽃받침 길이, 꽃받침 넓이]
y = iris.target
Create Model #
python
model = neighbors.KNeighborsClassifier(6)Model Fitting #
python
model.fit(x, y)Model Predict #
python
model.predict([[9, 2.5], [3.5, 11]]) # 각각의 분류 표시Plot Model #
Data Points #
python
plt.figure(figsize=(10,5))
plt.scatter(x[:, 0], x[:, 1])
plt.title("Data points")
plt.show()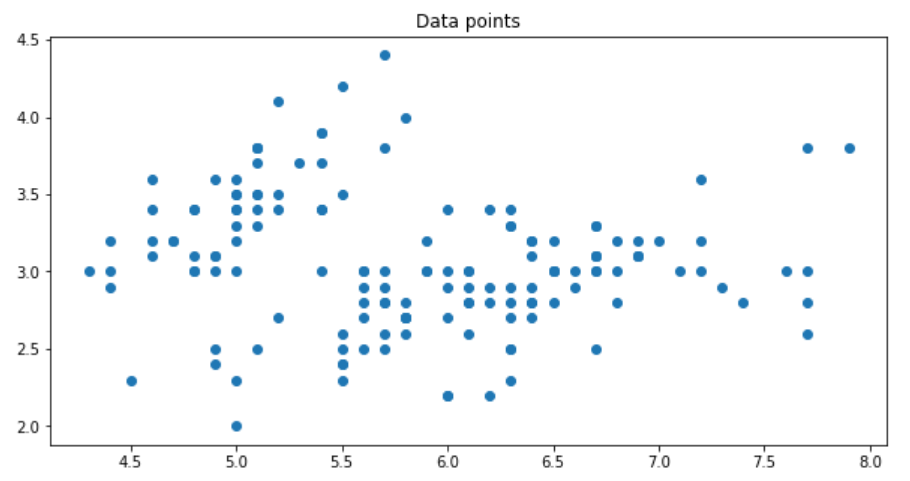
Plot KNN #
python
x_min, x_max = x[:,0].min() - 1, x[:,0].max() + 1
y_min, y_max = x[:,1].min() - 1, x[:,1].max() + 1

xx, yy = np.meshgrid(np.arange(x_min, x_max, 0.01), np.arange(y_min, y_max, 0.01))

Z = model.predict(np.c_[xx.ravel(), yy.ravel()])
Z = Z.reshape(xx.shape)
python
cmap_light = ListedColormap(['#FFAAAA', '#AAFFAA','#00AAFF'])
cmap_bold = ListedColormap(['#FF0000', '#00FF00','#0000FF'])

plt.figure(figsize=(10,5))
plt.pcolormesh(xx, yy, Z, cmap=cmap_light)

plt.scatter(x[:, 0], x[:, 1], c=y, cmap=cmap_bold, edgecolors='gray')
plt.xlim(xx.min(), xx.max())
plt.ylim(yy.min(), yy.max())
plt.title("3-Class classification (k = 1)")
plt.show()- K를 높일수록 결정 경계가 부드러워짐
