Okt Library #
- 한국어 형태소 분석기 KoNLPy 패키지에 속한 라이브러리
KoNLPy 테스트 #
python
from konlpy.tag import Okt

tokenizer = Okt()
tokens = tokenizer.pos("아버지 가방에 들어가신다.", norm=True, stem=True)
print(tokens)norm: 정규화(Normalization), ‘안녕하세욯’ -> ‘안녕하세요’stem: 어근화(Stemming, Lemmatization), (‘한국어’, ‘Noun’)
Pickle Library (Extra) #
- 파이썬 변수를 pickle 파일로 저장/불러오기
python
with open('raw_pos_tagged.pkl', 'wb') as f:
    pickle.dump(raw_pos_tagged, f)

with open('raw_pos_tagged.pkl','rb') as f:
    data = pickle.load(f)
크롤링 데이터 전처리 #
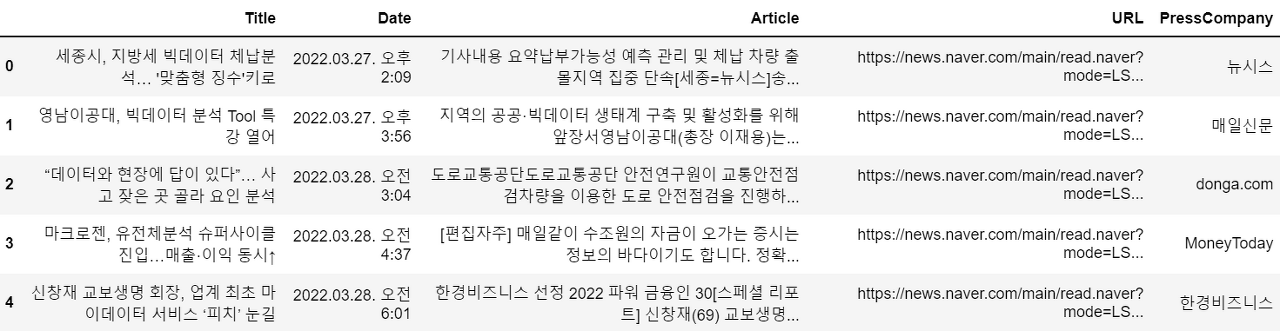
크롤링 데이터 불러오기 #
python
df = pd.read_excel('result_220328_1314.xlsx')
articles = df['Article'].tolist()
articles = ''.join(articles)- Article 데이터를 불러와서 리스트화 시키고 다시 하나의 문자열로 변환
형태소 단위 분해 #
python
from konlpy.tag import Okt
tokenizer = Okt()
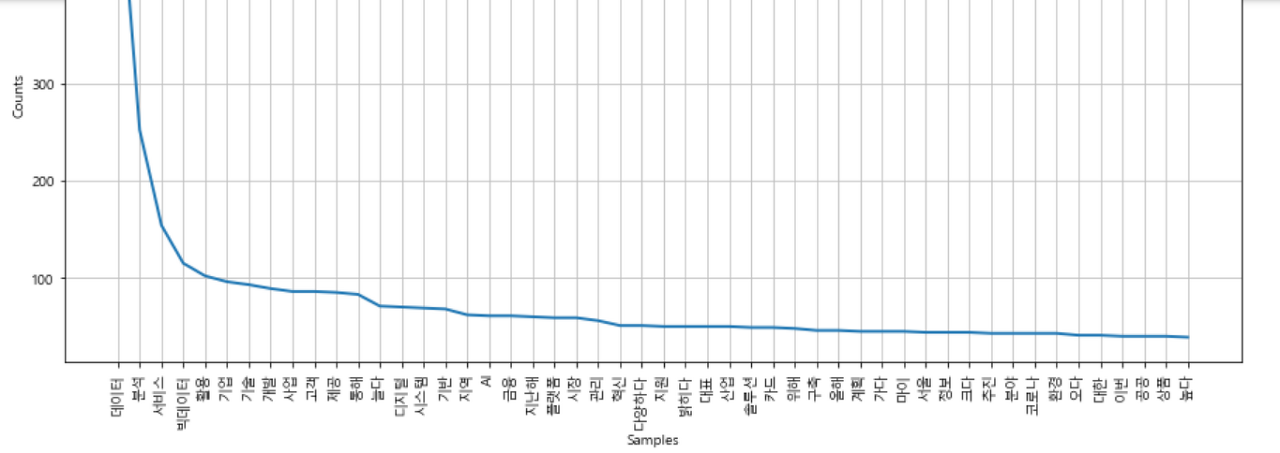
raw_pos_tagged = tokenizer.pos(articles, norm=True, stem=True)단어 등장 빈도 시각화 #
python
word_cleaned = ['불용어가 제거된 단어 목록']

# NLTK의 Text() 클래스에서 matplotlib의 plot 기능 제공
word_counted = nltk.Text(word_cleaned)
plt.figure(figsize=(15, 7))
word_counted.plot(50)